Your WooCommerce dashboard says you made $4,820 last month. Nice number. It’s also almost meaningless because it tells you nothing about what you kept.
Out of that $4,820, how much went to the products themselves? How much came back out as refunds? What did the payment gateway take? What about the ad spend that brought those buyers in? If you can’t answer within a few seconds, you’re running your store on revenue, and revenue is the number that feels good, not the number that pays you.
I build WooCommerce plugins for a living, and this gap bothered me for years. Store owners I worked with would tell me sales were up and then, three months later, mention they somehow had less money than before. Nobody was stealing from them. They just never saw the cost side of any sale, so they kept pushing products that sold well and earned nothing.
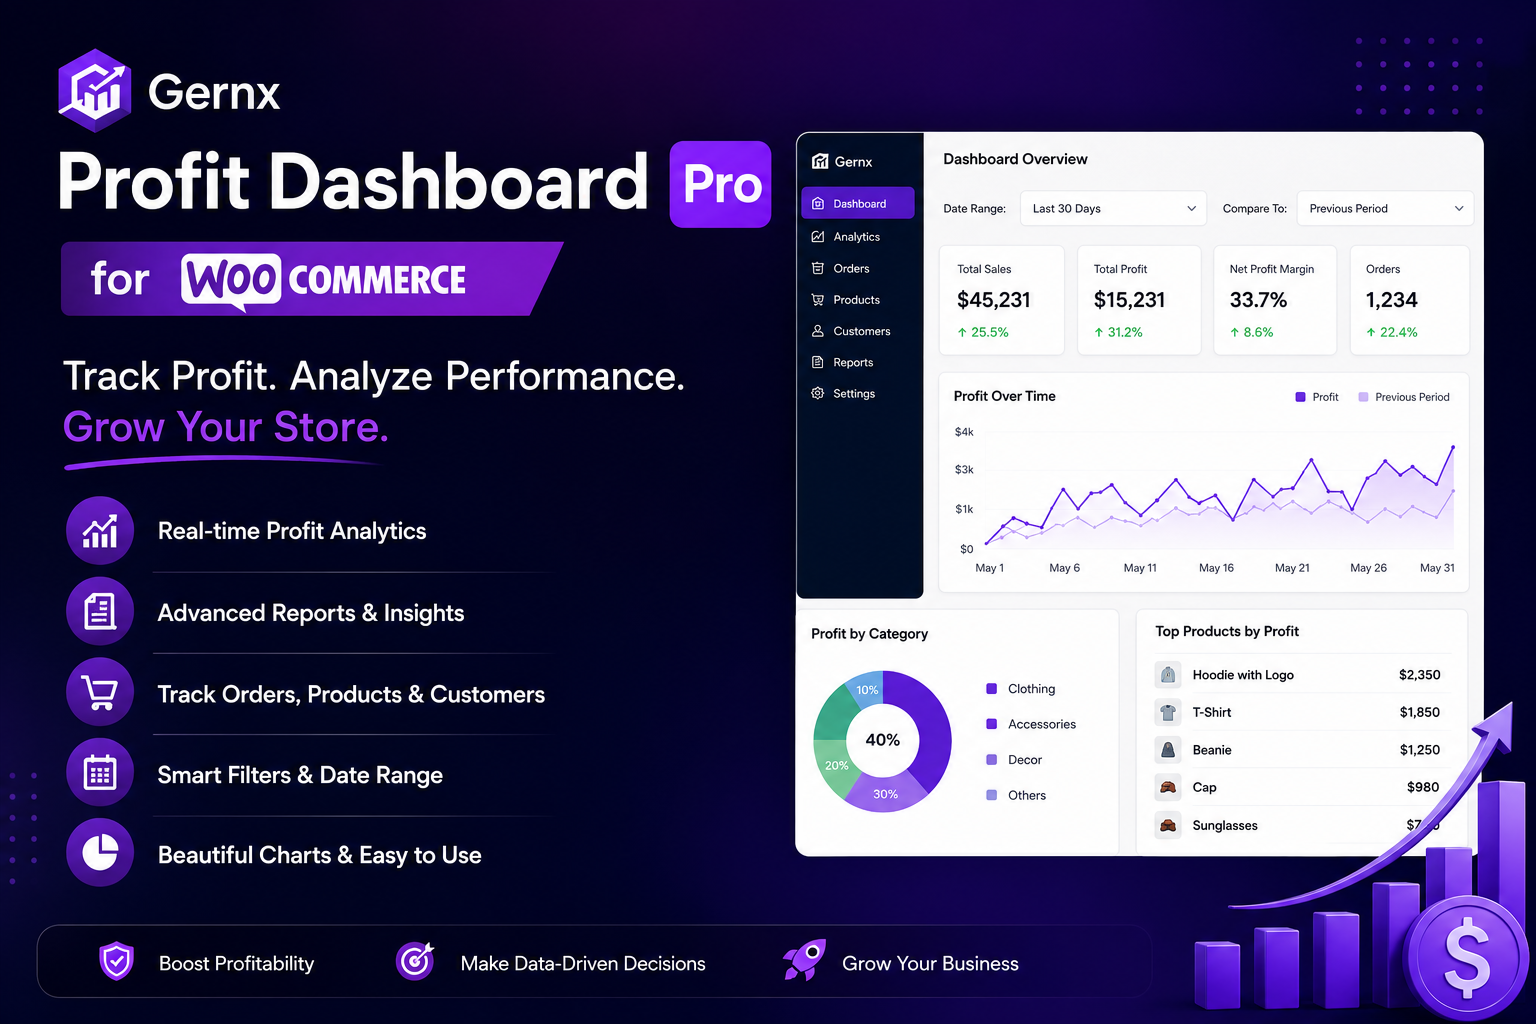
That’s why we built Gernx Profit Dashboard — a plugin that sits inside your WooCommerce admin and answers one question from every angle: after everything, what did you actually keep?
This article explains how it works, walks through every report, and gives you an honest list of pros and cons, including the things it doesn’t do. There’s a live demo if you’d rather poke at it yourself.
Why WooCommerce doesn’t show you profit
This isn’t a WooCommerce flaw exactly. WooCommerce is an order system. It knows what a customer paid. It has no idea what the product costs you, because you never told it. There’s no cost field on a standard WooCommerce product, so there’s nothing for a report to calculate margin from.
The Analytics section that ships with WooCommerce is genuinely decent for what it covers: orders, revenue, top sellers, tax collected. But “top sellers” ranked by revenue is a trap. Your best-selling product and your most profitable product are often different products, and sometimes the best seller is the one quietly losing you money on every order once you count shipping and fees.
The usual workaround is a spreadsheet. Export orders monthly, paste in costs from your supplier invoices, build formulas, forget to update it in March, and abandon it by June. I’ve seen this exact lifecycle at least a dozen times. The spreadsheet dies because it’s manual, and manual things die.
The fix is to give WooCommerce the missing number (cost per product) once and let the software do the rest on every order automatically. That’s the whole idea of the plugin.
What the Gernx Profit Dashboard does
You install it, and each product in your catalog gets a cost field. You enter what each product costs you: supplier price, or supplier price plus your per-unit shipping, however you want to define it. Variable products get a cost per variation because a small t-shirt and a 3XL usually don’t cost the same.
From that point on, every new order is logged with its revenue, its cost, and the difference. For your existing orders, there’s a one-click “Recalculate all orders” button that walks back through your order history and backfills the same data. Run it once after setup, and your history shows up in the reports.
Then you get a Profit Dashboard menu in your admin with reports that all read from this data:
- Profit Overview: revenue, cost, net profit, margin, break-even
- Product Profitability: your catalog ranked by profit, not sales
- Customer Profitability: which buyers actually earn you money
- Country Profitability: profit share by country
- Refund Analysis: refund totals and rate over time
- Expenses & Fees: log ad spend and overhead, see profit after expenses
- Inventory Value: what your stock is worth at your cost
- Profit Forecasting: monthly trend and a 30-day projection
Every report has date range tabs (7 days, 30 days, 90 days, 1 year), and the numbers follow the range you pick. The paid reports export to CSV if you want the raw data in a spreadsheet for your accountant.
One design choice worth mentioning: everything is calculated and stored on your own site. No external service, no API calls with your sales data, nothing about your orders leaves your server. If you sell in a niche where you’d rather not pipe your revenue through a third party, that matters.
How the profit calculation actually works
I want to be specific here because “profit” means different things in different tools, and vague definitions are how store owners get misled.
For each order, the plugin records:
Revenue — what the customer paid for the items.
Cost of goods — the cost you set on each product, multiplied by quantity, summed across the order. Products with no cost entered are treated as zero cost, which means their entire price shows as profit. This is the most common source of “my margin looks too good,” and the troubleshooting docs call it out. Enter your costs.
Refunds — when an order is refunded, the refund is tracked and reflected in the numbers, so a big refund month doesn’t hide inside a good sales month.
Expenses — costs that don’t belong to any single product. Ad spend, gateway fees, your email tool’s subscription, a virtual assistant. You log these in the Expenses & Fees screen, and the dashboard shows net profit after them. This is the difference between “gross margin” and “what actually hit my account,” and it’s where most stores get an unpleasant surprise the first time they look.
Net profit is revenue minus cost of goods minus refunds minus expenses. Margin is that as a percentage of revenue. The Overview also computes a break-even figure for the month, meaning the revenue level at which you’ve covered costs, which is a surprisingly useful single number to know when you’re deciding whether to push a promotion in the last week of the month.
None of this is exotic accounting. That’s the point. It’s the arithmetic you should be doing anyway, done automatically on every order.
A walk through each report
Profit Overview
The landing screen. Four cards at the top: revenue, cost, net profit, margin, for whatever date range you’ve picked. Below that, a revenue-vs-profit bar chart so you can see the gap between the two lines month by month, a cost-vs-profit pie, and the break-even figure.
The chart is the part I’d tell you to actually look at weekly. Revenue and profit usually move together, and the interesting weeks are the ones where they don’t: revenue up, profit flat means you sold more of your low-margin stuff, or a discount ate the difference.
Product Profitability
Your whole catalog, sortable by profit, revenue, or margin. Products appear here even before they’ve sold anything, so you can spot items where you’ve entered a cost but no price update, or vice versa.
This report is where the “best seller vs best earner” question gets answered. Sort by profit and compare with your WooCommerce top sellers list. If the two lists match, congratulations, your pricing is coherent. Most stores find at least one surprise: a mid-list product with a fat margin that deserves more promotion, or a hero product that earns less per month than something nobody’s marketing.
Customer & Country Profitability
Both answer the same shape of question at different zoom levels: who is worth acquiring more of?
The customer report ranks buyers by the profit they’ve generated, not the revenue. A customer who buys often but only buys your discounted, low-margin items ranks lower than one who buys rarely but takes full-price goods. If you do any kind of email marketing or VIP program, this is the list to build it from.
The country report draws profit share as a pie. If you ship internationally, it tells you whether that expensive cross-border logistics is actually earning its complexity. Sometimes a country that’s 15% of revenue is 4% of profit once shipping and refund rates are counted, and that’s a business decision hiding in plain sight.
Refund Analysis
Refund totals and refund rate for today, this week, this month, and this year, with the trend over time. Refunds are profit killers twice over: you lose the sale and usually eat the payment fee. A creeping refund rate is often the earliest signal of a product quality issue or a misleading product page, and it’s much cheaper to catch at 3% than at 8%.
Expenses & Fees
A simple ledger. Add an expense, give it a label and an amount, and it flows into the net profit numbers. I kept this deliberately plain. It’s not trying to replace your accounting software; it’s trying to make sure your dashboard’s “profit” number includes the $600 you gave Meta this month, because a profit number that ignores ad spend is fiction.
Inventory Value
What your stock on hand is worth at your cost, across products and variations. Useful for two things: knowing how much cash is sitting on your shelves, and catching products that are stocked but have no cost entered (the report flags those rather than guessing).
Profit Forecasting
A monthly profit trend with a projection for the next 30 days based on the last quarter. Months that lost money show below the zero line in red, profitable months in green above it. The projection is a straightforward trend estimate, not machine learning wizardry, and I’d rather tell you that plainly than dress it up. It’s there to give you a defensible guess, not a prophecy.
The Elementor widgets
If you build your site with Elementor, the plugin registers five widgets under a Gernx Widgets category: profit figures and mini reports you can place on any page, each with the full set of Elementor style controls.
The obvious use is an internal team dashboard: a private page where your staff sees this month’s numbers without wandering into wp-admin. The widgets only render their figures for logged-in shop managers, so a logged-out visitor sees nothing sensitive. That’s deliberate, and it also means if you preview the page logged out and the widget looks empty, that’s the security working, not a bug.
Setting it up (about ten minutes, honestly)
- Install and activate the plugin. If you bought Pro, activate your license key on the screen that appears.
- Open a few products and fill in the Cost field. Start with your top 20 sellers; you can do the long tail later.
- Go to Profit Dashboard → Overview and click Recalculate all orders. Wait for the count to finish. This backfills your order history into the reports.
- Add your recurring expenses (ad budget, tools, fees) in Expenses & Fees.
- Look at the Product Profitability report and prepare to be mildly annoyed by at least one product.
There’s a Diagnostics line under the recalculate button that tells you exactly how many orders are logged and what date range they cover, which makes “why is this report empty” a ten-second question instead of a support ticket. Reports look back up to one year, so if an old order isn’t showing, check that you’re on the 1-year tab first.
It works with HPOS (WooCommerce’s high-performance order storage), and the reports read from their own log table rather than hammering your orders table, so a big store doesn’t slow down when someone opens a report.
Free vs Pro
The free version, available on WordPress.org, gives you the core: real profit and margin numbers and the product reports. That’s genuinely usable on its own, and if all you want to know is “what’s my margin,” you may never need more.
Pro adds the Customer, Country, Refund, Expenses, Inventory, and Forecasting reports, CSV export, and the extra Elementor widgets. Pro costs $39.99 per year for a single site, or $99.99 once for a lifetime license. The yearly license covers updates and support while active, and the plugin keeps working even if you let it lapse; you just stop getting updates. Checkout and licensing run through Freemius, and there’s a 30-day money-back guarantee.
The honest way to decide: if you spend money on ads or ship to more than one country, the Expenses and Country reports alone will pay for Pro the first time they change a decision. If you’re a small store with organic traffic and domestic shipping, start free.
Pros and cons
I sell this plugin, so you should read this section skeptically. But I’d rather list the real limitations here than have you find them after buying.
Pros
- Profit, not revenue. Every report is built around what you keep, which is the number WooCommerce itself never shows you.
- Runs entirely on your own site. Your sales data never leaves your server, and there’s no external service that can have an outage or a price hike.
- Works with your existing orders. The recalculate button backfills history, so you get a year of hindsight on day one instead of starting from zero.
- Fast on large stores. Reports are read from a separate log table, so opening a dashboard doesn’t grind a store with 50,000 orders.
- Expenses are part of the math. Ad spend and fees are in the profit number, which is the difference between a dashboard and a decoration.
- Plain SVG charts, no chart library bloat, no jQuery plugins from 2014. The admin loads fast.
- Lifetime pricing exists. If subscriptions annoy you, $99.99 once and you’re done.
- Live demo available before you spend anything.
Cons
- You have to enter your costs. There’s no magic import from your supplier. For a catalog with 40 products, this is an evening’s work; for 400 variations, it’s a real chore, and the numbers are only as good as the costs you enter.
- Reports look back one year, not forever. For most operating decisions, a year is plenty, but if you want five-year profit archaeology, export the CSVs as you go.
- Variable products need per-variation costs to be accurate. If all your variations genuinely cost the same, fine, but if they don’t and you enter one number, your margin on the big sizes will be quietly wrong.
- The forecasting is a trend projection, not a crystal ball. It assumes your next month looks like your recent quarter. A viral TikTok or a supply crisis will make it wrong, as it makes every forecast wrong.
- It’s a young plugin. Version 1.x, small user base so far, no five-year track record. The upside is you get direct support from the developer (me, mostly) and feature requests actually land; the downside is you’re not buying something with ten thousand reviews.
- No monthly billing. It’s yearly or lifetime. I think monthly billing for a plugin like this is churn theater, but if you specifically want to pay $4 a month, this isn’t set up for that.
- Elementor widgets show figures to logged-in shop managers only. Correct behavior for financial data, but it means you can’t build a public “revenue counter” page with it. That’s intentional, and I’m not changing it.
Who it’s for
The plugin earns its keep for store owners who spend money to make money: anyone running ads, anyone with real supplier costs, anyone shipping to multiple countries, anyone with more than a handful of products where the margins differ. That describes most stores doing more than pocket-money volume.
It’s probably not for you if you dropship at fixed markup with one supplier and one country. Your margin is the same on everything, so a profit report just restates your revenue report with smaller numbers. It’s also not an accounting system: it won’t do your taxes, reconcile your bank, or replace whatever your accountant uses. It’s the operational layer, the thing you check on Monday morning, not the thing you file in April.
How it compares to the alternatives
Your realistic options for profit tracking in WooCommerce are a spreadsheet, an analytics SaaS, or a plugin.
The spreadsheet is free and dies of neglect, as covered earlier.
The SaaS route (the various ecommerce analytics platforms) is powerful and typically costs $20 to $100+ per month, wants API access to your store, and sends your sales data to someone else’s servers. For a large multi-channel operation, that’s often the right call. For a single WooCommerce store, paying $500 a year forever to learn your margin is hard to justify against a $39.99 plugin.
Among plugins, the differences come down to what’s included in the profit math and where the data lives. When you compare, ask three questions: does it count refunds against profit, can it include non-product expenses like ad spend, and does the data stay on your server? Those three separate a real profit tool from a revenue report with a costs column.
Frequently asked questions
-
Does it work with my existing orders?
Yes. New orders are tracked automatically, and the one-time Recalculate button backfills your history into the reports.
-
Will it slow down my store?
No. Reports are read from their own log table, and nothing runs on your customer-facing pages.
-
Is my sales data sent anywhere?
No. Everything is calculated and stored in your own WordPress database.
-
Does it work with HPOS?
Yes, it’s compatible with WooCommerce’s high-performance order storage.
-
What happens if my Pro license expires?
The plugin keeps working. You stop receiving updates and support until you renew.
-
Can I use one license on more than one site?
A single-site license covers one site. You can move it by deactivating it on the old site first. Localhost and staging activations don’t count against the limit.
-
Is there a trial?
No trial, but there’s a live demo where you can click through every report on a real store, and a 30-day money-back guarantee on Pro.
The bottom line
Revenue is a vanity metric with a paycheck’s cost on it. Every store owner learns this eventually; the only question is whether they learn it from a dashboard in month two or from their bank balance in year two.
Gernx Profit Dashboard is a focused tool for one job: showing you, inside the admin you already use, what your WooCommerce store actually keeps after costs, refunds, and expenses. It asks one thing of you (enter your costs) and automates everything after that.
Try the live demo, start with the free version on WordPress.org if you want to test the water, and go Pro when the Customer, Country, and Expenses reports start looking like money. At $39.99 a year, it needs to change roughly one pricing decision to pay for itself.